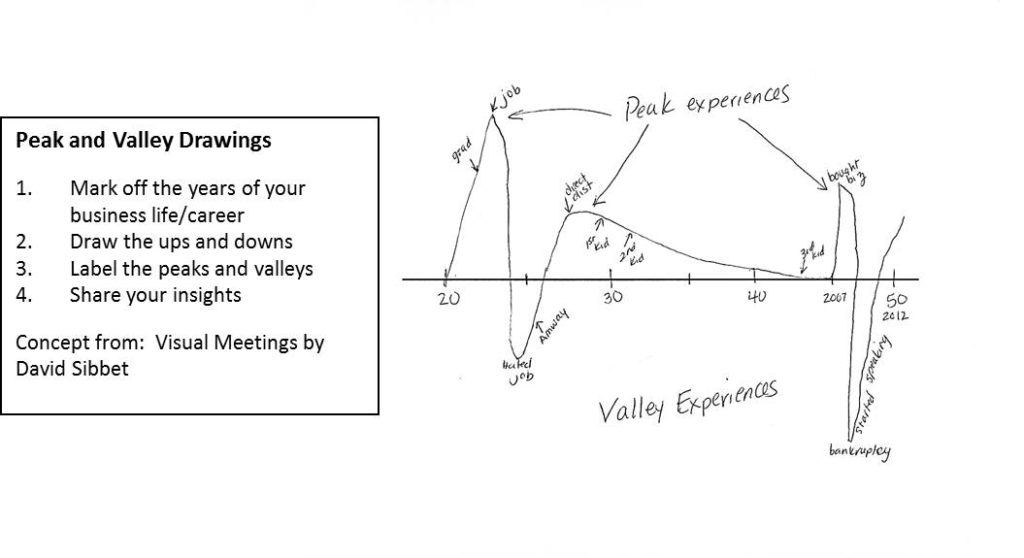
Digging Up Stories: Highs and Lows Graph

Another way to recall stories, is to draw a “Highs and Lows” graph, or as David Sibbet discusses in his book, Visual Meetings, Peak and Valley Experiences. Decide on a time period (your whole life, a year) and draw a horizontal time line across the middle of a blank sheet of paper. Then mark off time segments […]
